
Sound Visualisation Tools for Communication

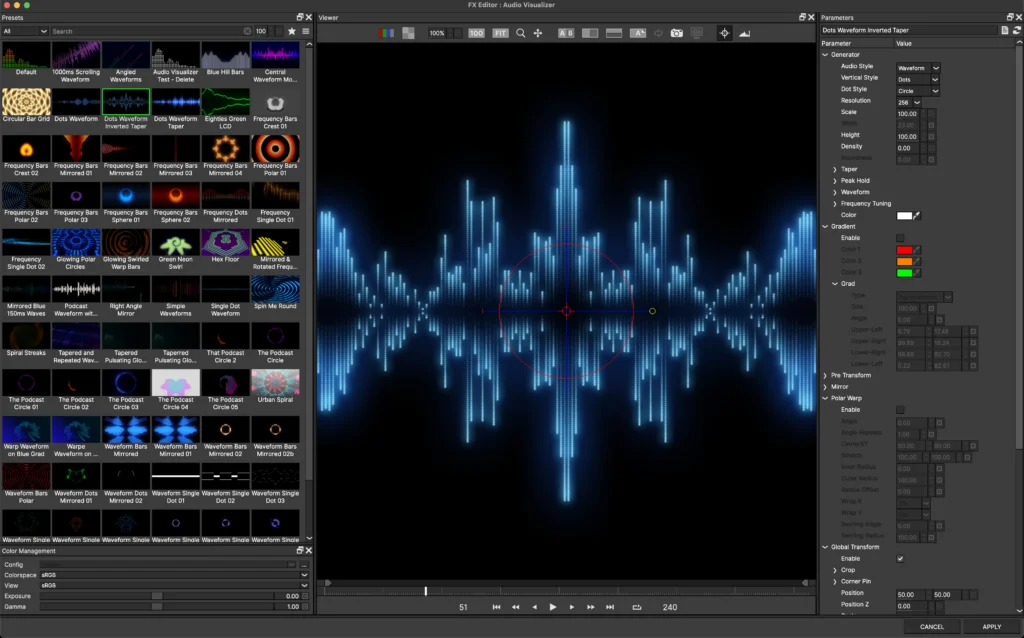
Sound visualisation tools turn live or recorded sound into images such as waveforms, spectrograms or pitch curves. In communication and learning, they are used to give visual feedback on voice, explain sound, or make music accessible. The evidence behind specific claims is limited, so they work best alongside, not instead of, professional support.
This guide from Access & Assistive Tech Notes explains what these tools show, how they are used and where the evidence stands.
The American English spelling, sound visualization tools for communication, refers to the same category. These tools appear in music players, speech software and accessibility settings, but their role in communication is less widely explained.
- What are sound visualisation tools?
- How visualising sound supports communication and learning
- Types of sound visualisation tools
- What the evidence says: Picturing Sound and related research
- How to choose a sound visualisation tool
- Limitations and what these tools do not do
- Frequently asked questions
- Sources
What are sound visualisation tools?
An audio visualizer is a tool that converts sound into animated images. Sound visualisation tools form a related category used for speech and communication work. A waveform shows when sound is present and how loud it is over time. A spectrogram shows which frequencies are present at each moment, which is useful for seeing speech sounds. A pitch curve shows how the voice rises and falls, a feature often used in intonation practice. According to the World Health Organization, assistive technology includes products that maintain or improve an individual’s functioning and independence, and sound visualisation can form part of that wider field when used for feedback or access. These tools do not change the sound; they make selected acoustic features visible, so a speaker, learner or therapist can see patterns that are otherwise hard to perceive.
How visualising sound supports communication and learning
Visualising sound supports communication mainly by giving fast visual feedback that speech and hearing alone may not provide. In many settings, visualising sound for communication is used as a support rather than as a standalone method. Williams (2006) describes four broad ways in which visualisation has been proposed for communication and learning.
- Voice feedback. Pitch curves, spectrograms and waveform displays can show pitch, loudness and timing during speaking practice. A voice pitch display can show whether a sound is steady or variable, which can be useful in pronunciation work and voice awareness.
- Support for augmentative and alternative communication (AAC). Some AAC systems use visual feedback to confirm that a sound or switch press has been registered. The feedback may appear as an on-screen change when a selection is made, helping the user check that the system has responded.
- Sound awareness for people with hearing loss. A waveform or spectrogram can make ambient sounds visible, providing an extra cue when auditory information is missing or uncertain. This can help a person notice changes in the room or check whether a device has produced sound.
- Accessible music and arts. Visualisers can make music perceivable through shape and movement, and can support creative projects, performances and teaching. They may be used to project live sound as moving images, but the creative uses are not standardised.
For example, a person working on intonation can see a pitch curve rise or fall, and a learner studying vowels can compare spectrogram patterns. This does not replace listening; it makes an invisible feature easier to study. At present, these are useful aids rather than measured interventions. The practical value comes from the feedback they make visible; the clinical value still needs stronger studies.
Types of sound visualisation tools
Most sound visualisation tools fall into four groups, each showing a different feature of the signal. No single type is inherently better; the right choice depends on the feature you need to see.
| Type | What it shows | Typical communication use | Limitation |
|---|---|---|---|
| Waveform / oscilloscope | Amplitude over time | Showing whether a sound is present and how loud it is | Does not show pitch or clarity of speech |
| Spectrogram / spectrum analyser | Frequency over time | Showing speech sounds, vowel qualities or environmental noise | Dense display that requires interpretation |
| Pitch curve / voice feedback | Fundamental frequency of the voice | Visual feedback for intonation or voice control | Tracks pitch only, not other speech features |
| Sonogram | Distribution of spectral intensity | Analysing sound quality in detail | Less common in everyday communication tools; technical display |
These categories are not exclusive. A single tool may combine a waveform and a spectrogram, and some programmes switch between views. For example, a spectrogram can distinguish a high vowel from a low vowel by the position of its dark bands, while a pitch curve can show whether a question is rising. The practical point is to match the display to the task.
The most commonly cited source on this topic is Williams (2006), “Picturing Sound – An overview of its efficacy”, published in the ArtAbilitation 2006 proceedings. It is an overview, not a randomised controlled trial. It summarises proposed uses for communication and motivation and reports that efficacy has been documented only in limited form. Williams (2006) is often cited because it consolidates scattered reports into one overview, not because it provides a large dataset. The paper indicates that visualisation has been suggested for communication and motivation, but the underlying reports are descriptive or small rather than clinical. Researchers would need controlled comparisons, larger samples and standardised measures before visualisation could be considered an established therapy. For that reason, sound visualisation is better viewed as a support tool than as an evidence-based intervention.
How to choose a sound visualisation tool
Start with the sound feature you need to see and the setting in which you will use it. Four technical checks are useful.
- Microphone support. Confirm that the tool works with a live microphone and not only with pre-recorded audio files.
- Real-time vs pre-recorded. Real-time feedback is often needed for voice work; pre-recorded analysis may suit teaching or music study. A school may need a pre-recorded spectrogram for teaching, while a clinic may need live pitch feedback.
- Accessibility of the interface. Controls should be usable with a keyboard or switch access, and the visual display should offer enough contrast to read.
- Privacy and data handling. Tools that record audio may process voice data, so review the privacy policy before use.
No single tool is right for every user. The choice depends on the task, the platform you can use, and how the data are handled.
Limitations and what these tools do not do
Sound visualisation tools do not provide therapy, diagnosis or a substitute for professional support. They show acoustic features, not meaning, cognition or communication ability. They do not replace a speech and language therapist, audiologist or teacher, and they should not be used to make clinical decisions. If a visual display suggests a problem with hearing, voice or communication, the next step is a professional assessment, not self-treatment. If you use these tools as part of a programme, follow the terms of use and seek advice from a qualified professional.
Frequently asked questions
These are common searches about sound visualisation and audio visualisers.
What is an audio visualizer?
A tool that converts sound into animated images such as waveforms or spectrograms.
What are sound visualisation tools for communication?
Tools that turn speech, music or ambient sound into visual feedback to support understanding, learning and expression.
Can Google identify a sound?
Google can identify songs via Now Playing or Assistant; general sound identification is not the same as visualisation.
Is there a free online audio visualizer that doesn't have a watermark?
Some browser tools exist, but check licence terms and accessibility features; free versions may lack mic support or export options.
Do sound visualisation tools help with speech therapy?
They can provide visual feedback as support, but the evidence is limited and they do not replace speech and language therapy.
For any specific communication need, ask a qualified professional rather than relying on an online tool.
Sources
- World Health Organization, Assistive Technology health topic.
- Williams (2006), “Picturing Sound – An overview of its efficacy”, ArtAbilitation 2006 proceedings.
Further reading